TikTok Weekly Watch Distribution (Interquartile Range) by Age in Germany — Q1 2025

Results as of

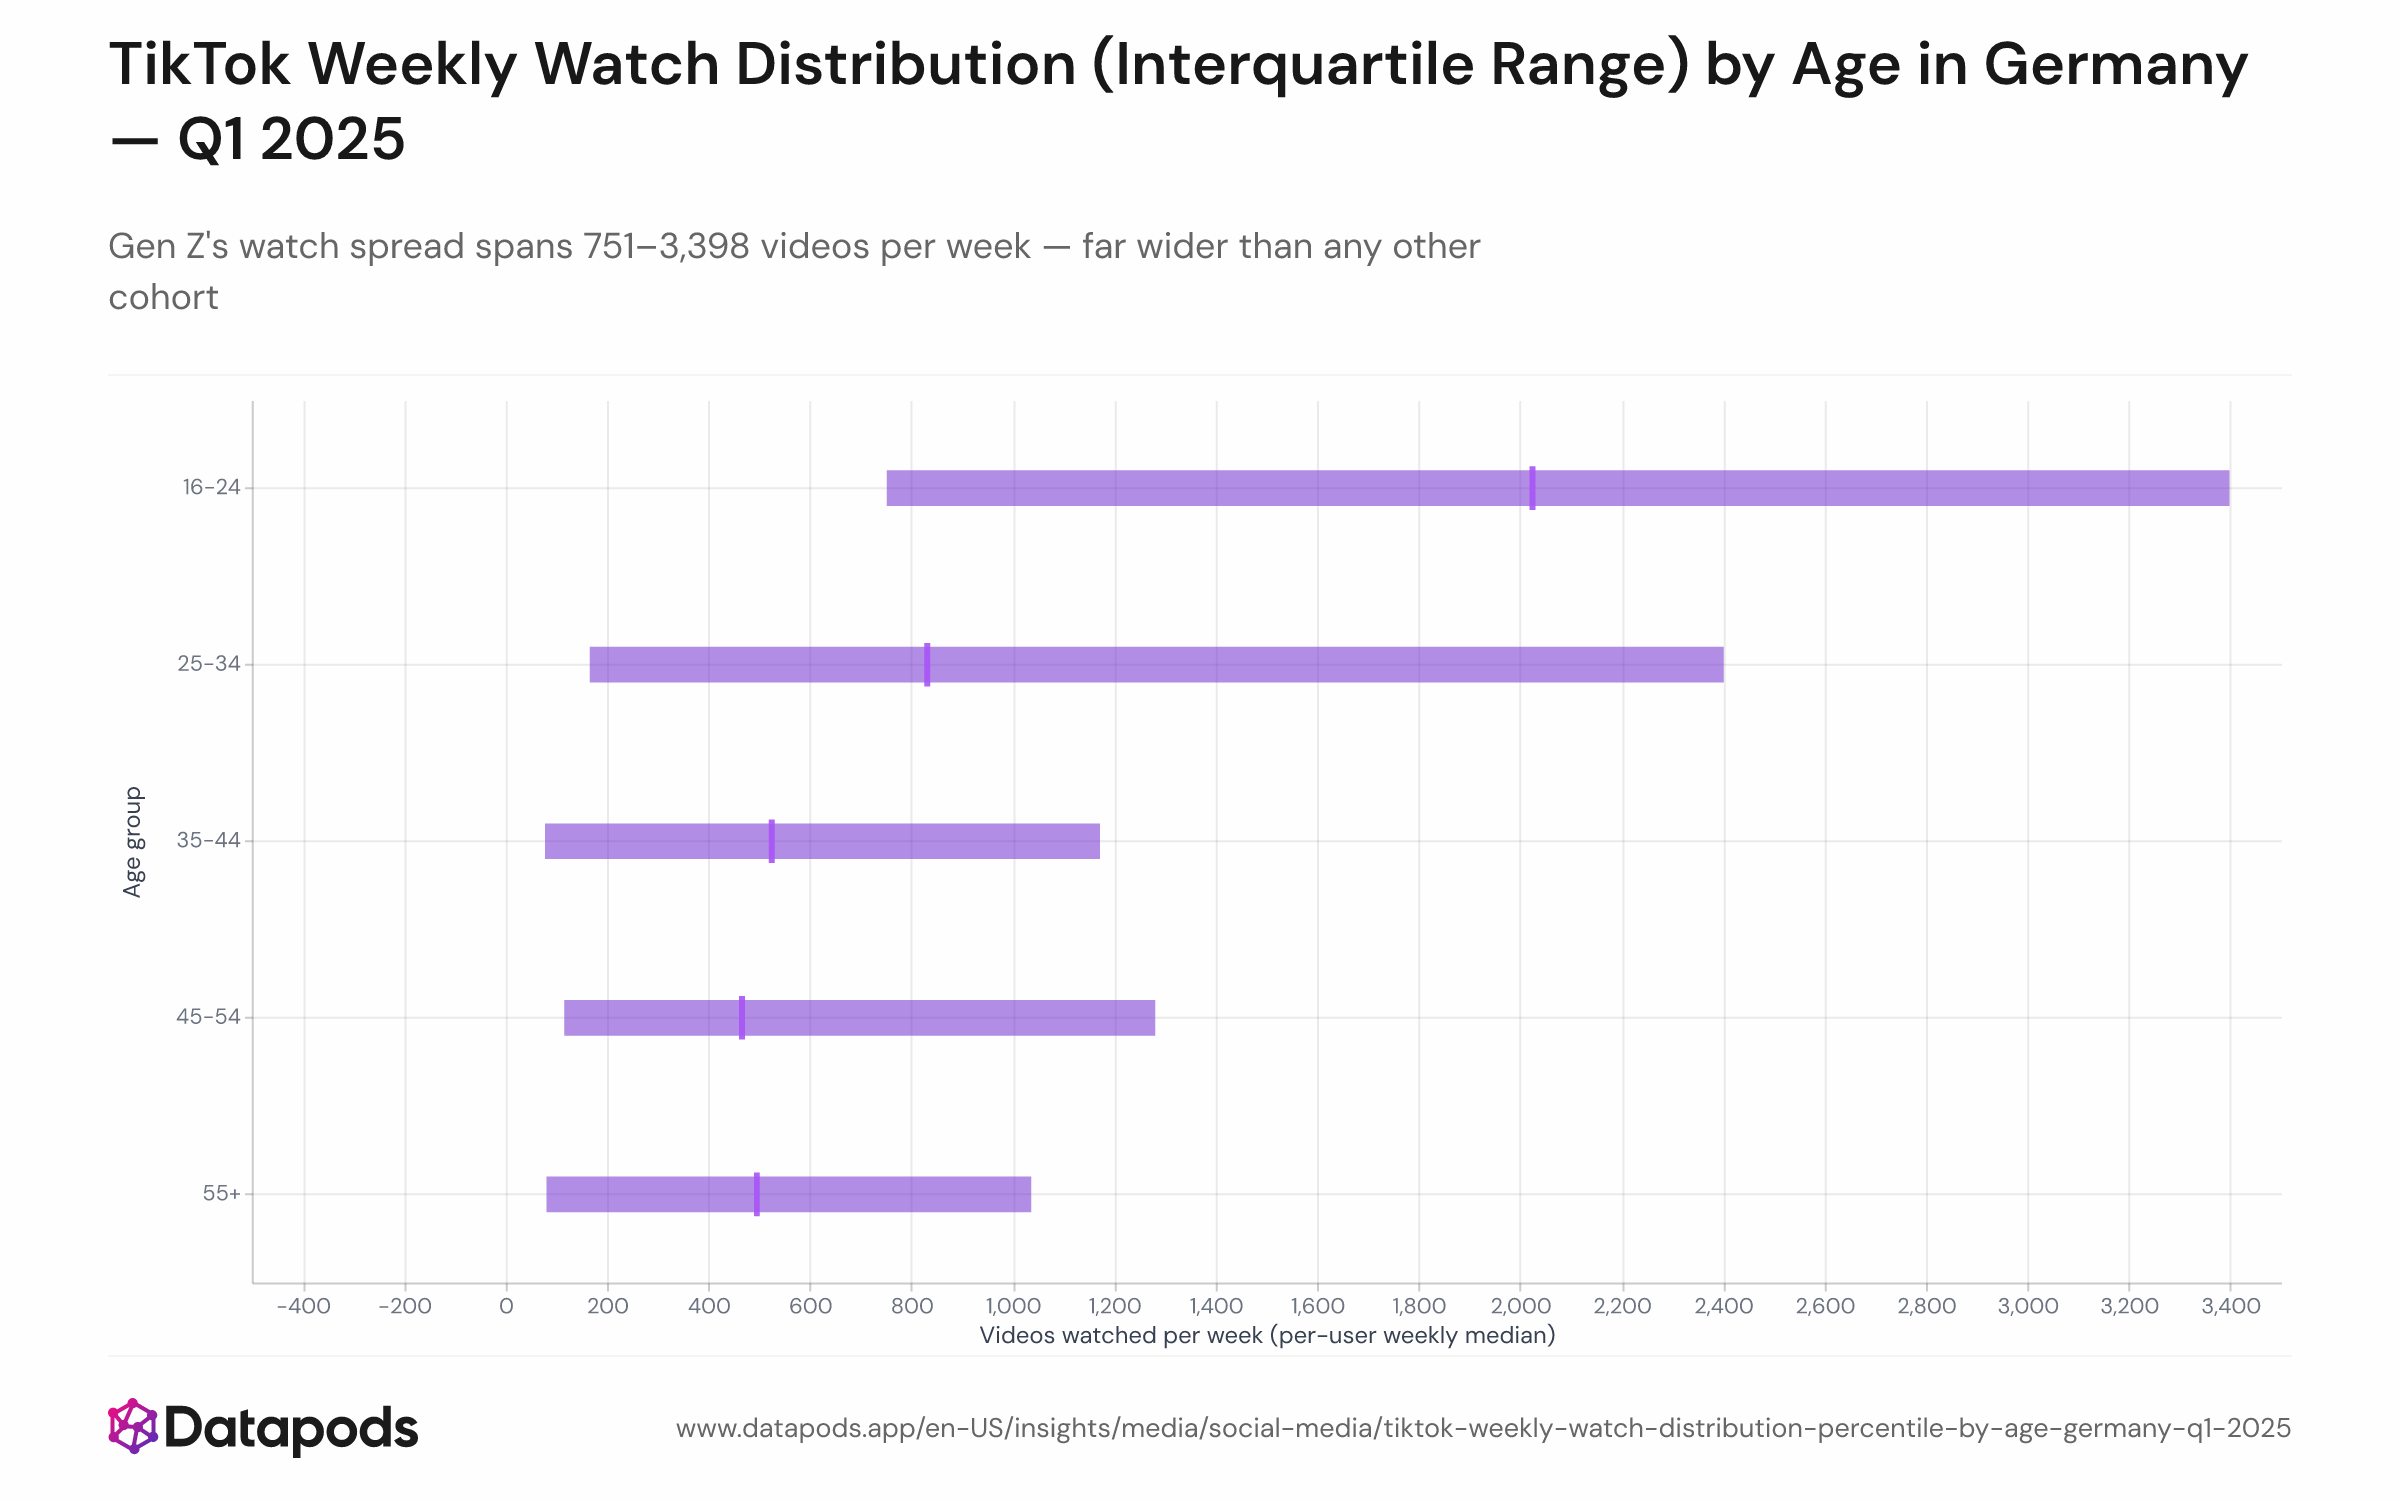
Review Q1 2025: Gen Z's watch spread spans 751–3,398 videos per week — far wider than any other cohort

TikTok Weekly Watch Distribution (Interquartile Range) by Age in Germany — Q1 2025Box plot or range chart with interquartile bars (light blue or gray), cohort median marked as a dark tick. 16–24 cohort IQR: 751–3,398. 25–34 IQR: 336–1,784. 35–44 IQR: 78–1,172. 45–54 IQR: 96–950. 55+ IQR: 235–1,179. All labeled with tick and value. The visual emphasis on the 16–24 cohort's wide spread underscores not just heavier consumption, but greater heterogeneity. This reflects the diversity within Gen Z — some users treat TikTok as a background app, while others have integrated it as a primary form of entertainment and social connection. Older cohorts show tighter clustering, suggesting more uniform, moderate engagement patterns.
Box plot or range chart with interquartile bars (light blue or gray), cohort median marked as a dark tick. 16–24 cohort IQR: 751–3,398. 25–34 IQR: 336–1,784. 35–44 IQR: 78–1,172. 45–54 IQR: 96–950. 55+ IQR: 235–1,179. All labeled with tick and value. The visual emphasis on the 16–24 cohort's wide spread underscores not just heavier consumption, but greater heterogeneity. This reflects the diversity within Gen Z — some users treat TikTok as a background app, while others have integrated it as a primary form of entertainment and social connection. Older cohorts show tighter clustering, suggesting more uniform, moderate engagement patterns.
Info
Sample size
n = 570
Data date
Q1 2025
Segment
All segments
Platform
TikTok
Market
Germany

Analysis

While median watch counts reveal age-based differences in typical behavior, the spread within Gen Z reveals stark inequality in viewing intensity. The middle 50% of 16–24-year-olds spans from 751 to 3,398 weekly videos—a 4.5× range. By contrast, 35–44-year-olds occupy a compressed band of 78–1,172, and 55+ range from 235–1,179. This dispersion indicates that TikTok consumption among Gen Z is highly polarized: some are occasional viewers, while others consume the platform obsessively.


This analysis is based on public segment data. For deeper cuts, use our Enterprise interface.

Methodology

Each user (with ≥2 active weeks in Q1) assigned a per-user median weekly watch count. Cohort distribution summarized as 25th percentile (Q1), median (50th), and 75th percentile (Q3). Sample after the ≥2-week filter: 570 users (16–24 n=144, 25–34 n=169, 35–44 n=155, 45–54 n=63, 55+ n=39).