Loyalty & Savings App Weekly Session Frequency in Germany — Q1 2026
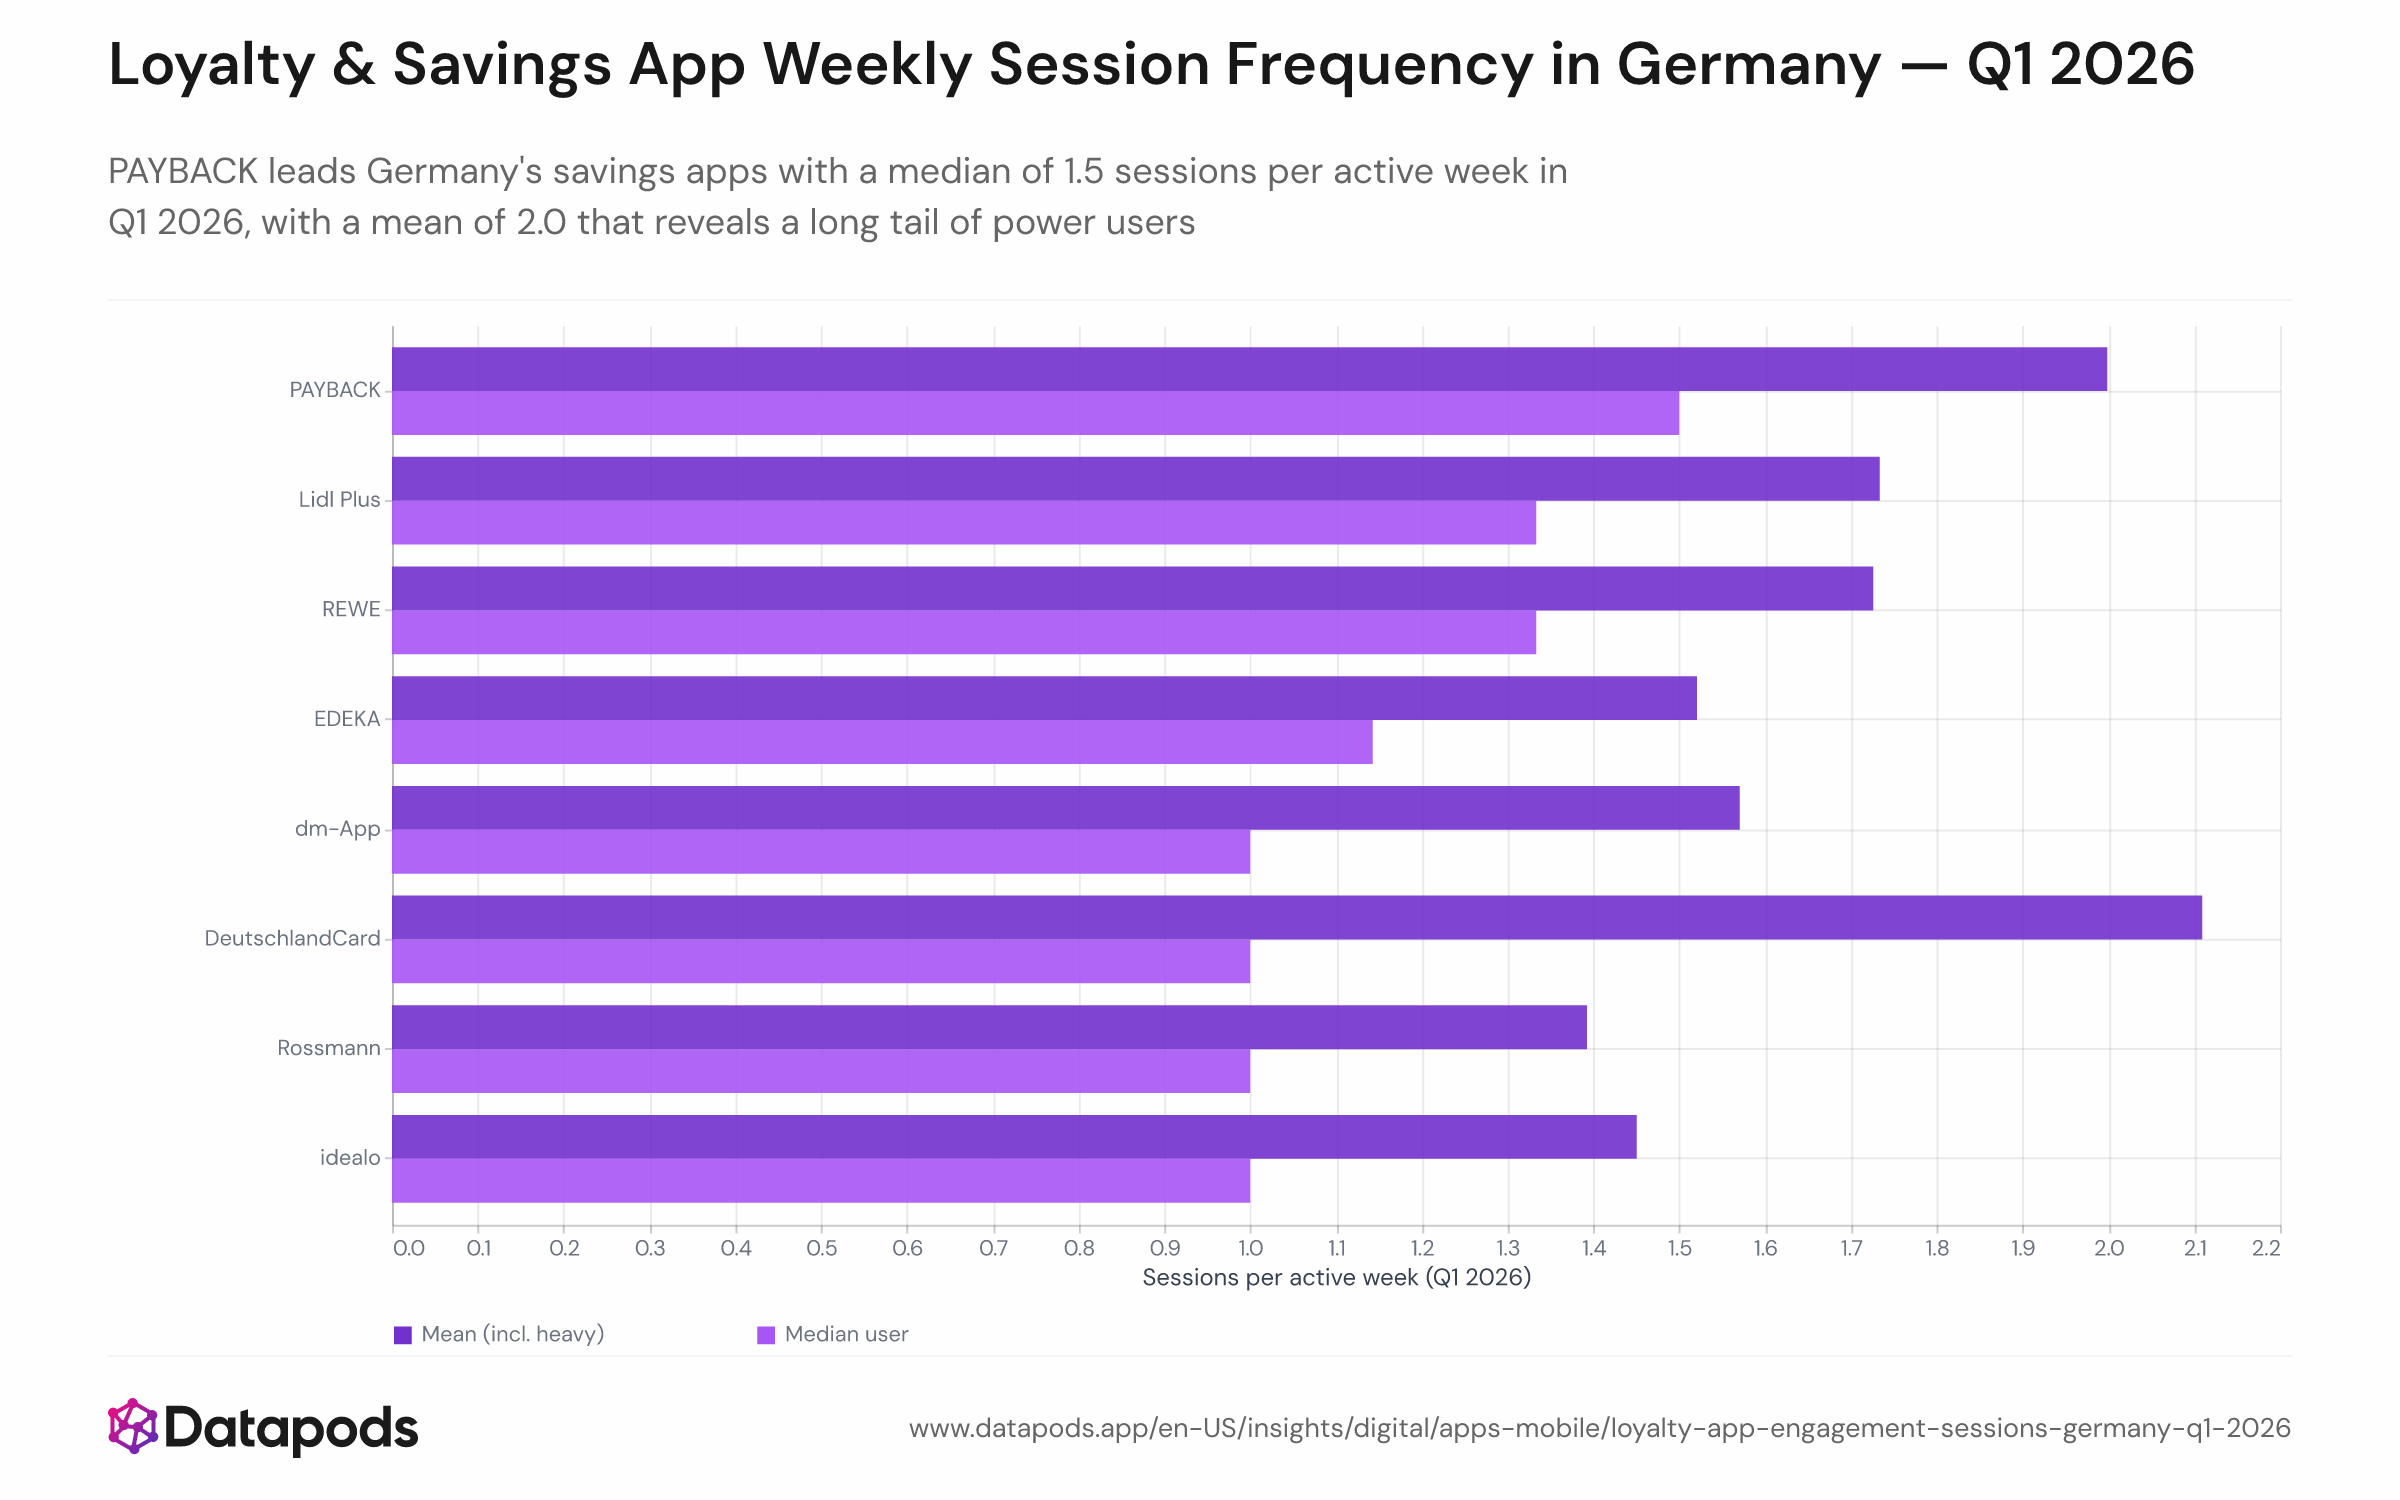
Review Q1 2026: PAYBACK leads Germany's savings apps with a median of 1.5 sessions per active week in Q1 2026, with a mean of 2.0 that reveals a long tail of power users
Info
- Sample size
- n = 2,999
- Data date
- Q1 2026
- Segment
- All segments
- Platform
- Play
- Market
- Germany
Analysis
Across Germany's major loyalty and savings apps in Q1 2026, weekly session frequency is remarkably compressed: six of eight apps cluster between a median of 1.0 and 1.3 sessions per active week, and PAYBACK's median of 1.5 represents the highest engagement in the category. In every app, the mean exceeds the median — a consistent long-tail pattern where a small group of power users drives total session volume well above what the typical user generates.
Flat engagement despite a shifting competitive landscape
The Germany coupon and loyalty app market saw major structural changes through 2024–2025 — DeutschlandCard's full digitisation, REWE's launch of its own Bonus program, and PAYBACK's addition of EDEKA as a partner — yet none of these disruptions moved session frequency. The median has varied by less than 0.2 sessions per active week across any app over the full Q2 2024 to Q1 2026 window, suggesting that how often users open their savings app is determined more by personal shopping rhythm than by app-specific features or incentive structures. PAYBACK's edge in both median (1.5) and mean (2.0) sessions likely reflects its broader multi-partner utility: with over 700 partner companies in Germany, there are more daily contexts that prompt an app open. For the audience profile of the most engaged savings app users, see heavy savings app users by gender and age in Germany 2025.
This analysis is based on public segment data. For deeper cuts, use our Enterprise interface.
Methodology
Weekly session frequency is calculated per user as total app open events divided by the number of distinct weeks in which the user was active during Q1 2026 (January–March 2026). Median and mean are reported across all users with at least one recorded session in the quarter for a given app. This is a within-user behavioral metric and is not projected to the wider population. App cohort sizes range from approximately 400 to 3,000 users per app in the quarter.